| < Previous page | Next page > |
|
Printouts or Plots
As well as Word or Excel reports; Ezigrade can also produce two different types of printouts / plots directly to any windows supported printer or plotter. The first printout is simply a printout of what is displayed upon the screen. ie a plot showing points, heights, grids, field definitions etc. The second printout is more of a report and shows a cut/fill report for the section nominated or for the whole field. If you are using the "Partial Land Grading" option then we suggest you create reports as you go from within the "Set Min Max Grades Dialog".
Screen dump / Printout
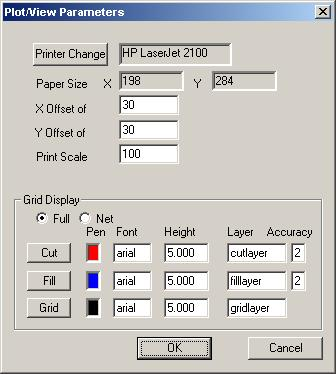
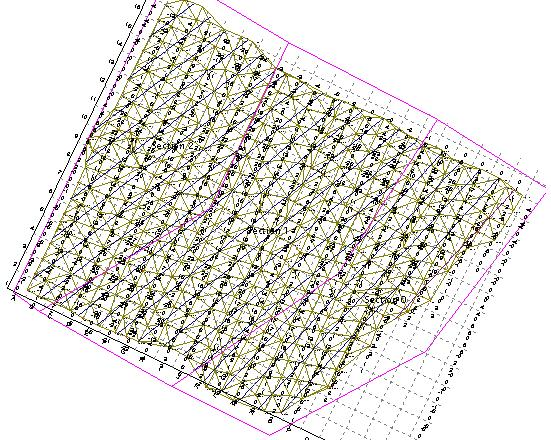
This displays a plot of the points, grids and sections making up the field. The elements which are displayed within this plot are controlled from the View menu. The individual elements that can be displayed are:
A sample print out is seen below:
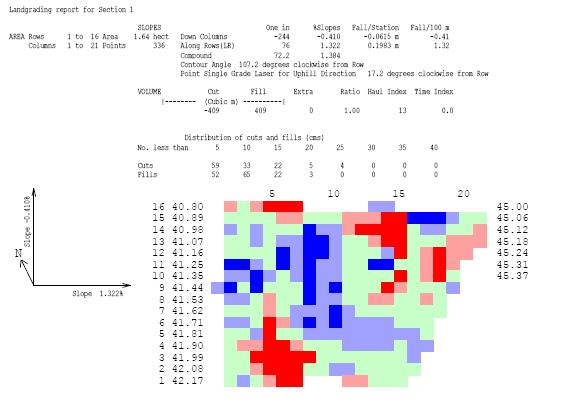
Cut/Fill Report (for Plane of Best Fit Option)
This creates a more traditional report directly to your printer. It displays the current section with appropriate section statistics. The north point is shown and each grid cell is shaded an appropriate colour. To access this function use the "Elevation Plot" or "Elevation Plot Preview" from the "File" menu. Make sure that for A4 print outs that you create the printout in Landscape mode. A sample printout is seen below:
You may also view the pdf file directly. It will be found in the help directly and is called elevationplot.pdf
|